Aside from the slow movement of the extremely powerful Hurricane Dorian, 2019 was a fairly typical North Florida year. The water never dipped below 50 F, there wasn’t a July hurricane, and there were slightly more days of North wind than South.
Disclaimer: This data is still subject to personal bias and small errors here and there. It’s become the story I tell myself about the year from the perspective of a surf instructor working with surfers of all ages and ability levels as opposed to an intermediate or advanced surf enthusiast.
Notable observations and surprises from 2019
- During February there were no swell periods of 12 seconds or longer. Winter is usually a time where coastal storms in New England can move out from behind Cape Hatteras into the open Atlantic and produce swells of at least 15 seconds.
- In 2018 there were 3 days with 17+ second swell periods. In 2019 there were none. The best days of surf from Dorian and Humberto featured swell periods of only 10 seconds. On a related note 2019 recorded 17 more days (93 total) of short period wind swell.
- There were almost 40 (38) head high+ days in 2019. Of those 38 days, 15 of them had offshore winds. This year more than half of the head high+ days had strong onshore winds. Between Hurricanes Dorian and Humberto September accounted for 12 head high+ days, 5 offshore and 7 onshore.
- Late August (8/21 – 8/25) featured a severe jellyfish outbreak. These have become a regular occurrence for us in late August or early September. The tides, direction of wind and waves, and location North or South along the beach all affect your likelihood of being stung. Murky water that has been flushed out of the marshes or intercoastal waterway seems to contain the highest densities of jellyfish this time of year.
- 2019 was a year of extremes. There were more flat days, more waist high or below days, and more head high and over days. As many head high+ days as 2019 produced there were none in May, June, or July.

Top 5 days of 2019 – in descending chronological order.
- 12/23 – Low pressure developed right off the coast of Florida and after two days of onshore winds everything came together for a full day of sizable, clean surf. Two more days of sizable, windy surf followed.
- 11/18 – Broad low pressure set-up far enough South and offshore to be fully positioned in Florida’s swell window. The waves were good across the entire state this day. At 15 seconds this was the longest period “Top 5 Day” of 2019.
- 9/17 – The clean-up day of the Humberto swell. Hurricane Humberto combined with a long fetch of NE wind to give us nearly a full day of waves when the wind finally went offshore.
- 9/5 – The clean-up from the passage of Hurricane Dorian. The swell dropped quickly this day but as far as form goes sunrise revealed some of the most classic waves of the year.
- 3/21 – For 2 years in a row March has turned out a “Top 5 Day” of surf. A fun morning with a light crowd and a powerful 10 second swell. Every “Top 5 Day” except for 11/18 featured a 10 second swell period.
Honorable Mentions
- 11/15 – Part of the run of surf leading up to 11/18.
- 9/23 – The best day locally from the Hurricane Jerry swell.
- 9/16 – The 2nd best day of the Humberto swell.
- 9/4 – The day Hurricane Dorian made it’s closest pass to the Florida coast. The biggest surf of the year.
- 4/19 – The wind went from strong South to Southwest by evening. At 8 seconds this was the shortest period excellent surf of 2019.
- 2/20 – This was the standout day in February.
- 1/24 – The second swell of 2019 but the first that really cooperated locally.
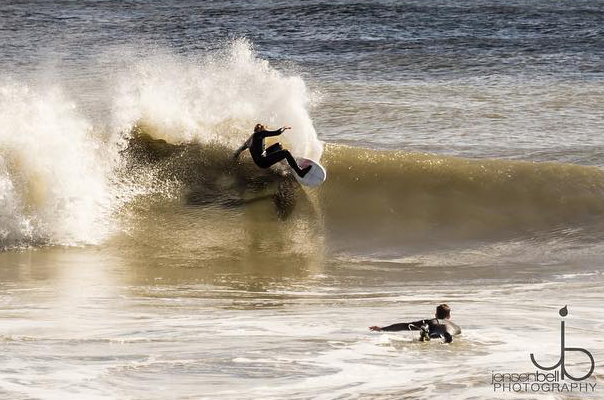
Bailey Riggan (pictured below, Photo Credit: Jensen Bell) was ripping.

Data
1) Wave heights
| Flat – Shin | | Knee – Waist | | Chest – Shoulder | | Head + | |
|---|---|---|---|---|
| Jan. | 11 | 14 | 5 | 1 |
| Feb. | 5 | 17 | 4 | 2 |
| Mar. | 5 | 19 | 4 | 3 |
| Apr. | 4 | 19 | 4 | 3 |
| May. | 0 | 28 | 3 | 0 |
| Jun. | 5 | 25 | 0 | 0 |
| Jul. | 0 | 27 | 4 | 0 |
| Aug. | 2 | 23 | 5 | 1 |
| Sep. | 0 | 10 | 8 | 12 |
| Oct. | 3 | 11 | 12 | 5 |
| Nov. | 1 | 16 | 9 | 4 |
| Dec. | 7 | 11 | 6 | 7 |
| 2019 | 43 | 220 | 64 | 38 |
| 2018 | 35 | 188 | 116 | 26 |
2) Water Temperature
| Below 50 F | | Below 60 F | | Below 70 F | | Above 70 F | | Above 80 F | |
|---|---|---|---|---|---|
| Jan. | 0 | 21 | 31 | 0 | 0 |
| Feb. | 0 | 20 | 28 | 0 | 0 |
| Mar. | 0 | 2 | 31 | 0 | 0 |
| Apr. | 0 | 0 | 19 | 11 | 0 |
| May. | 0 | 0 | 0 | 31 | 11 |
| Jun. | 0 | 0 | 0 | 30 | 30 |
| Jul. | 0 | 0 | 0 | 31 | 30 |
| Aug. | 0 | 0 | 0 | 31 | 31 |
| Sept. | 0 | 0 | 0 | 30 | 30 |
| Oct. | 0 | 0 | 0 | 31 | 12 |
| Nov. | 0 | 0 | 18 | 12 | 0 |
| Dec. | 0 | 8 | 31 | 0 | 0 |
| 2019 | 0 | 51 | 158 | 207 | 145 |
| 2018 | 12 | 67 | 166 | 199 | 141 |
3) Wind: Onshore vs. Offshore (Choppy vs. Clean)
| Onshore (All Day) | | Offshore/Light (At Some Point) | ||
|---|---|---|---|
| Jan. | 14 | 17 | |
| Feb. | 15 | 13 | |
| Mar. | 14 | 17 | |
| Apr. | 15 | 15 | |
| May. | 11 | 20 | |
| Jun. | 11 | 19 | |
| Jul. | 7 | 24 | |
| Aug. | 7 | 24 | |
| Sep. | 16 | 14 | |
| Oct. | 18 | 13 | |
| Nov. | 14 | 16 | |
| Dec. | 16 | 15 | |
| 2019 | 158 | 207 | |
| 2018 | 133 | 232 | |
4) General Wind Wave Direction
| North | | South | | Neutral (Straight) | ||
|---|---|---|---|---|
| Jan. | 18 | 8 | 5 | |
| Feb. | 10 | 7 | 11 | |
| Mar. | 16 | 10 | 5 | |
| Apr. | 10 | 16 | 4 | |
| May. | 3 | 19 | 9 | |
| Jun. | 5 | 18 | 7 | |
| Jul. | 9 | 17 | 5 | |
| Aug. | 10 | 16 | 5 | |
| Sep. | 21 | 7 | 2 | |
| Oct. | 15 | 12 | 4 | |
| Nov. | 22 | 3 | 5 | |
| Dec. | 18 | 8 | 5 | |
| 2019 | 157 | 141 | 67 | |
| 2018 | 119 | 167 | 80 | |
5) Swell Period in Seconds
| < 8 | | 8 – 11 | | 12 + | | 17 + | ||
|---|---|---|---|---|---|
| Jan. | 13 | 12 | 6 | 0 | |
| Feb. | 7 | 21 | 0 | 0 | |
| Mar. | 11 | 18 | 2 | 0 | |
| Apr. | 10 | 17 | 3 | 0 | |
| May. | 11 | 10 | 10 | 0 | |
| Jun. | 8 | 20 | 2 | 0 | |
| Jul. | 4 | 20 | 7 | 0 | |
| Aug. | 5 | 15 | 11 | 0 | |
| Sep. | 2 | 15 | 13 | 0 | |
| Oct. | 7 | 9 | 15 | 0 | |
| Nov. | 7 | 14 | 9 | 0 | |
| Dec. | 8 | 21 | 2 | 0 | |
| 2019 | 93 | 192 | 80 | 0 | |
| 2018 | 76 | 212 | 76 | 3 | |